 |
|
|
|
Cash Bids
Market Data
News
Ag Commentary
Weather
Resources
|
Is American International Group Stock Underperforming the S&P 500?/American%20International%20Group%20Inc%20HQ%20sign-%20by%20DCStockPhotograph%20via%20Shutterstock.jpg)
Born in Shanghai in 1919 and now headquartered in New York, American International Group, Inc. (AIG) has evolved into a global insurance powerhouse. From protecting small businesses to shielding corporations, AIG’s portfolio spans commercial property, liability, workers’ compensation, environmental coverage, and crisis management. Its expertise lies in managing complex risks for individuals, institutions, and industries worldwide - across over 200 countries and jurisdictions. Today, with a market capitalization of $45.5 billion, AIG stands as a resilient player navigating shifting economic tides and emerging global challenges. “Large-cap stocks” are the heavyweights of Wall Street – companies worth $10 billion or more that command both market clout and investor trust. AIG falls right into that bracket, and it’s no fluke. Its journey there was carved by decades of calculated expansion, global reach, and the ability to adapt through economic storms. Its presence in the large-cap arena speaks less of chance and more of consistent resilience and long-term trust built with investors. But size isn’t everything, and performance matters. And that’s where things get interesting. Back in April, AIG touched a 10-year high of $88.07. Fast forward to today, and the stock trades roughly 7.7% below that peak. Over the past three months, AIG is down 5.4%, while the S&P 500 Index ($SPX) has climbed 8.1% over the same stretch. That’s underperformance, no doubt. 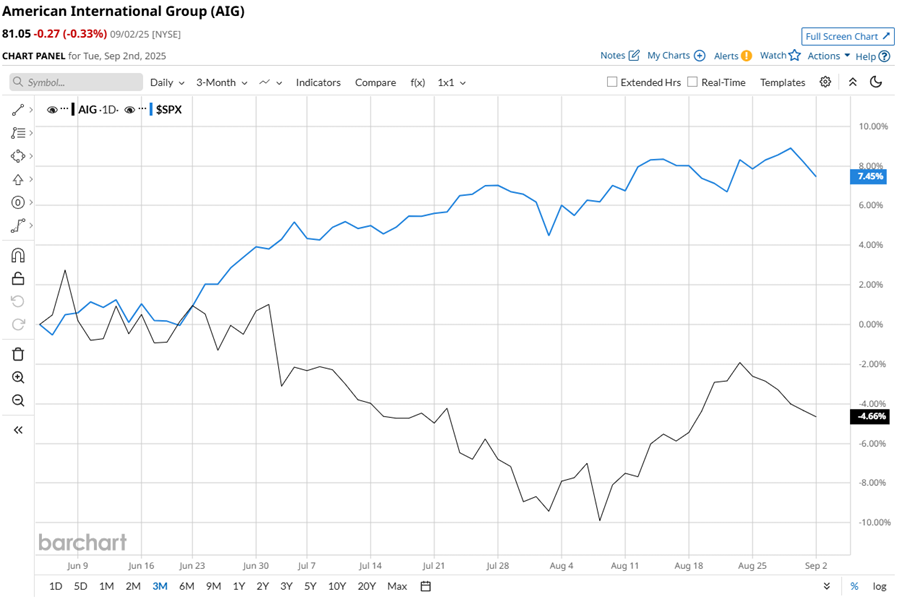
Still, zoom out, and the story gets a little more nuanced. AIG has gained 11.3% on a year-to-date (YTD) basis, edging past the S&P 500’s 9.1% return. But looking over the past 52 weeks, the tables turn again. The index has delivered 13.6% gains over the past year, comfortably outpacing AIG’s 5.2% climb. It has a solid momentum over 2025, but is sluggish when viewed across a longer horizon. AIG’s stock momentum has been volatile through 2025. After climbing steadily above its 50-day and 200-day moving averages in spring, it hit resistance around July and dipped sharply in August. However, a late-August rebound pushed shares back above the 200-day average, signaling a cautious recovery, though lingering volatility keeps investors on edge. 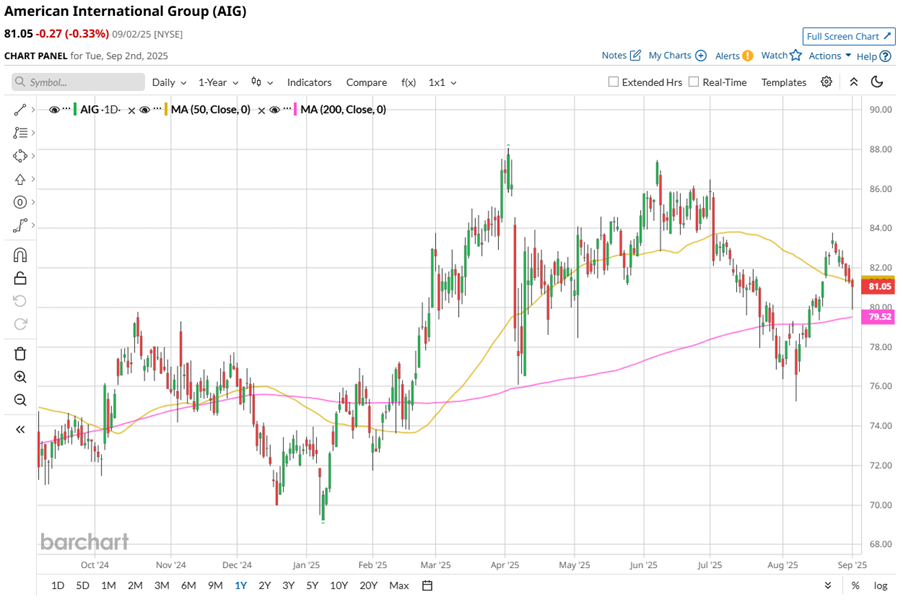
While AIG’s stock stayed in the green for 2025, it dipped nearly 3% after its Q2 earnings report despite delivering standout numbers. The company posted adjusted EPS of $1.81, up 56% year over year (YoY), with a solid core operating ROE of 11.7%, which underscored its solid execution and the effectiveness of initiatives such as AIG Next, which delivered over $500 million in savings ahead of schedule and significant operational improvements. AIG’s General Insurance underwriting income soared 46% to $626 million, and $2 billion was returned to shareholders. Credit upgrades from S&P Global and Moody’s underscored its improving financial strength, while AIG Next delivered $500 million in savings ahead of schedule. Yet investors weren’t entirely convinced. Net premiums written (NPW) rose 8% in Q1 and then just 1% in Q2, while Global Personal NPW slipped 3% due to a quota share reinsurance treaty, and property premiums dropped 8%. The expense ratio climbed 50 bps YoY, while combined ratios worsened across North America and International segments. Adding to the pressure, rising catastrophe losses, California wildfires, social inflation, and tariffs are squeezing margins. Heavy AI-driven transformation efforts face regulatory scrutiny, keeping profitability in check despite operational gains. Still, AIG is not exactly lagging its peers. The stock has outpaced its peer Arch Capital Group Ltd.’s (ACGL) 1.1% dip in 2025 and 19.3% decline over the past 52 weeks. Plus, Wall Street is not bearish. Among the 21 analysts covering the AIG stock, the consensus rating is a “Moderate Buy.” Its mean price target of $89.05 represents a 9.9% premium to current price levels. On the date of publication, Sristi Jayaswal did not have (either directly or indirectly) positions in any of the securities mentioned in this article. All information and data in this article is solely for informational purposes. For more information please view the Barchart Disclosure Policy here. |
|
|